
AZ Auditor General Report: Schools are spending LESS on instruction, MORE on counselors - LOWEST IN 23 YEARS!!
AZ Auditor General Report: Schools are spending LESS on instruction, MORE on counselors - LOWEST IN 23 YEARS!!
Despite more money than ever, schools are not spending it on instruction...and the test scores show it

In this Stack:
New public school spending report from the Auditor General
Billions in new money allocated - where is it going?
Answer: Less instruction, more therapy…and the ACT scores show it
Case in point: Plummeting Science Scores in Scottsdale
The Kicker? Teachers got raises anyway
Disclaimer. Lots of data and graphs in this post, some thinking required - for a short TL;DR version, go to X here.
The Arizona Auditor General’s report on fiscal year 2023 is out. The numbers are staggering - on a number of levels.
Total Spending
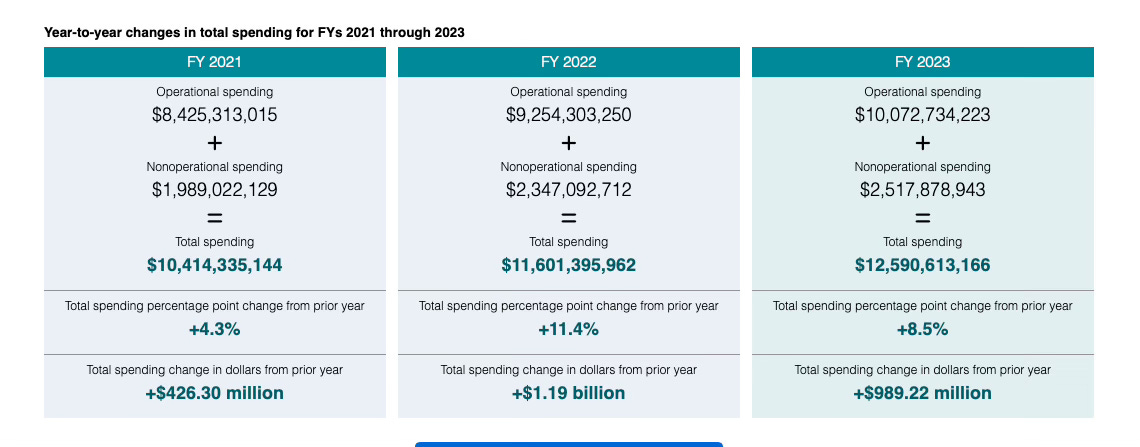
First, consider that Arizona schools have received more money than ever: almost $1B additional funding in 2023 over 2022, which was on top of the $1.19B of additional funding in 2021, which was on top of the $426M increase in 2020.
Now consider that in 2021 Arizona’s statewide total enrollment was 1,112,256. In 2023 that number increased to 1,125,618. So in three years, all those billions were going to educate only 13,362 extra students. That’s like adding, roughly, one small school district slightly 1/2 the size of Scottsdale Unified. For billions of extra money.
So what did they spend it on?

With all those billions - where is it going?
Turns out - not on instructing students.
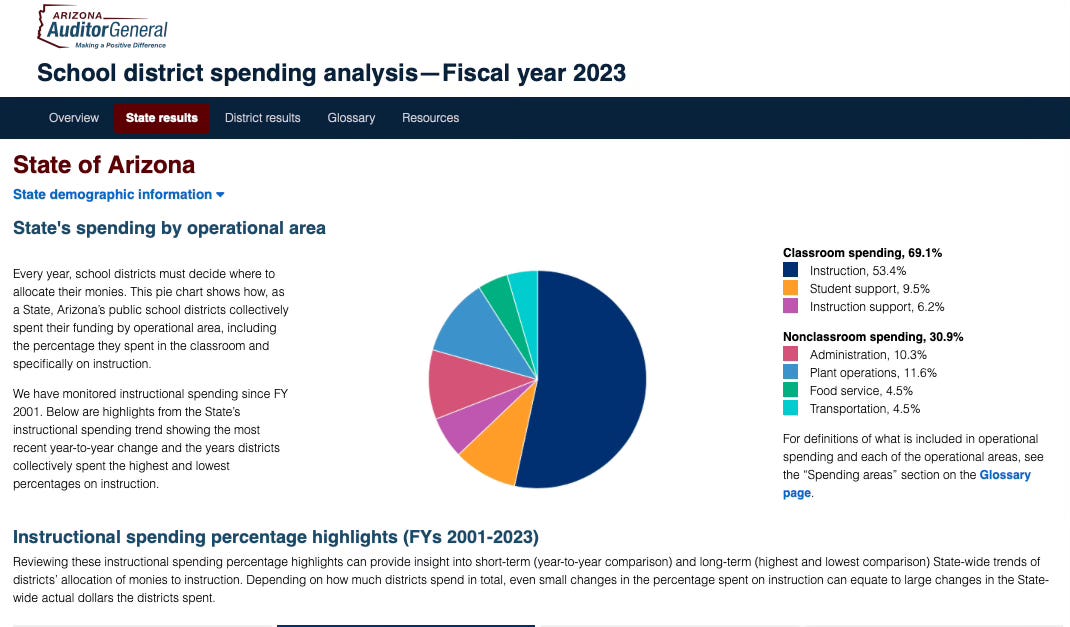
When analyzing operational spending, the auditor general follows federal requirements for reporting school expenditures, breaking down the outflows into seven categorizes. For purposes of this Stack, I’m looking at two:
“Instruction” which includes teacher pay and benefits, but other things that directly relate to instruction delivery, and presumably, improves outcomes: teacher aides (such as math and reading specialists), general instructional supplies, field trips, athletics, cocurricular activities - the “active ingredients” to what students learn and experience in public education; and
“Student support” this term is often used as a euphemism for behavioral health workers like counselors and social workers, but also includes audiologists, speech therapists, and nurses. There are over 1,525 school counselors alone in Arizona (as of 2021) - so I suspect a non-trivial amount of “student support” is actually behavioral health services, with nursing coming in second.
This category is comparatively skyrocketing…and the timing coincides with Public Ed’s demand for more…counselors. But the reality is “student support” spending does not translate (despite their trade associations’ literature) into increased academic achievement and outcomes for the average student in the aggregate.
And the test scores show it.
Instructional Spending at All-Time Low

In 2023, instructional spending, as a total of all spending, increased in absolute numbers by $341M…but as a percentage of all spending it went down -1.1% to comprise only 53.4% of all spending.
68.4% or over two-thirds, of ALL schools decreased their instructional spending in 2023, opting to direct more funding to other priorities.
Here’s the key takeaway:
The auditor general has tracked the Instructional Spending Percentage (ISP) since 2001 when ISP was 58.6% of all spending. ISP has never been this low. School districts are choosing to spend less on instruction - take a look for yourself:

So where is the money going?
Here are the state averages: a 9% increase in operational spending equal to $974 per student - but look at the caveat:
“However, only $407, or 42%, of the increased per student spending went toward instruction, which is a lower proportion than in the previous 3 fiscal years.”
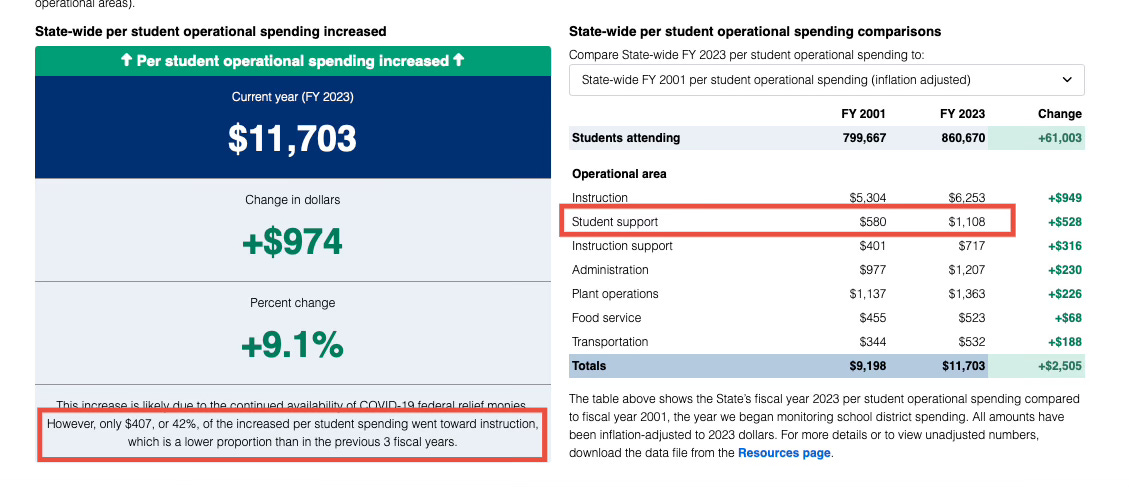
Now look at the average spent on “student support” in 2001 vs 2023: a 2X increase: from $580 to $1108 per student.
There are 1,125M students in Arizona. That’s a lot of money going to “support” - imagine if the instructional spending doubled over those 22 years!
On why districts reduced instructional spending, the Auditor General asked them to explain and their response was…they needed more more money for counselors and “teachers’ teachers”:
“District-provided examples of this spending including counselors and instructional coaches …”
Instructional coaches are what you call teachers that teach teachers how to teach, not kids how to learn.

So, there you go. In the last two decades, the only expenditure item that doubled is “support services” that psychologize kids, not educate them, that address feelings, not numbers, not science, not reading, writing, or any other cognitively demanding subject.
Has it worked? Are student test scores any better? Are academic outcomes correlated with increased behavioral health services over direct, brass-tacks, core academic instruction spend?
Of course not.
In December I wrote about the devastating 10-year low in ACT scores. (Click to redirect):

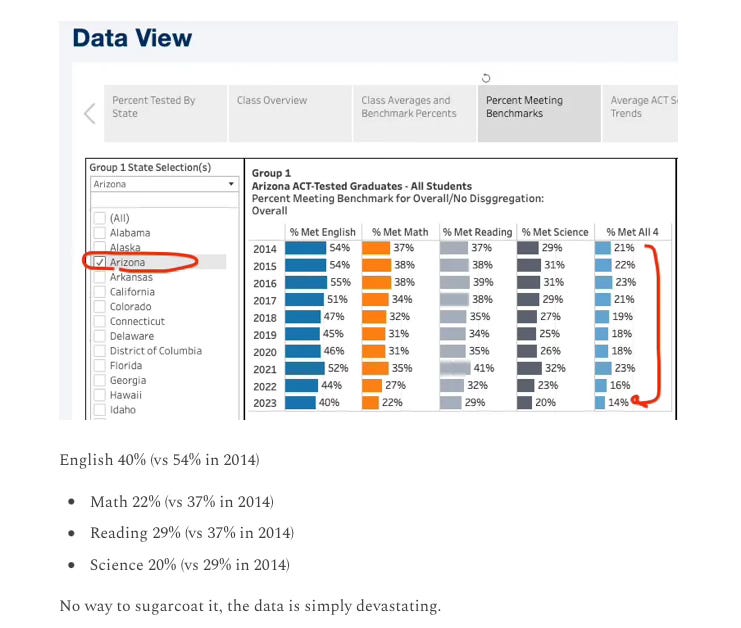
We’re not just talking about a low, final score - it’s worse than that: Only 14% of 2023 test takers met all 4 core subject, minimum-level benchmarks in English, Math, Reading and Science, vs 21% ten years ago!
So, that’s the dismal picture at the macro state level; let’s also look at the district-level for a case-in-point: Scottsdale Unified (SUSD).
Plummeting Science Scores in Scottsdale
SUSD’s budget allocation to ISP used to be much, much higher - 63.7% in 2004 vs 54.6% now. That level of investment apparently paid off as the district gained regional status and national prestige with college admissions officers. Even today this reputation, built on generations of prior commitment and good stewardship, continues to pay dividends. Attend any SUSD high school graduating class ceremony - year after year an impressive number of SUSD’s top students are accepted to highly selective colleges across the country. (As I repeatedly say, it’s not the top that needs attention - it’s that public ed is failing the mid-to-bottom).
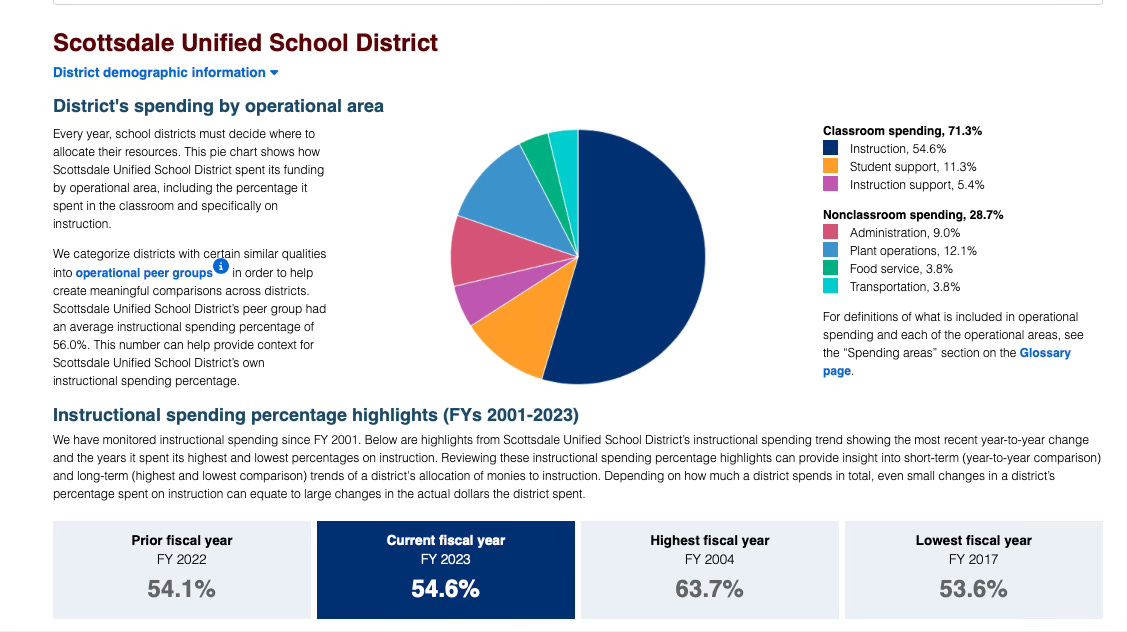
From 63.7% to 54.6%…almost a 10% drop in their multimillion dollar budget now NOT going to instructional spending. You might have heard that in 2020 the district hired a new top administrator. What happened after that? Did he bring new budget priorities and strategies to raise student outcomes?
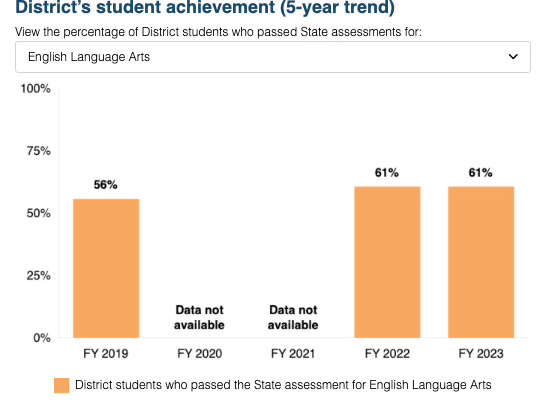
Behold the 5-year trend in science scores:

That’s a 24% drop in science scores since 2019. (And no, don’t say “covid” - covid was not a cognitive impairment virus).
And here’s math - showing materially zero improvement.

But hey the ELA scores are up, so they can write more cogently about their lack of math and science skills.
What changed at SUSD since 2019?
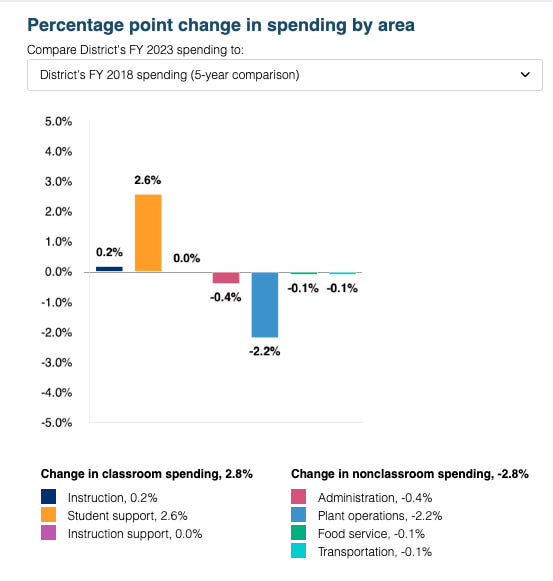
Priorities changed. Leadership changed.
And “student support” services aka behavioral health - has gone up 2.6% the past 5 years. Less instruction, more therapeutic pedagogy.
Can somebody please do something?
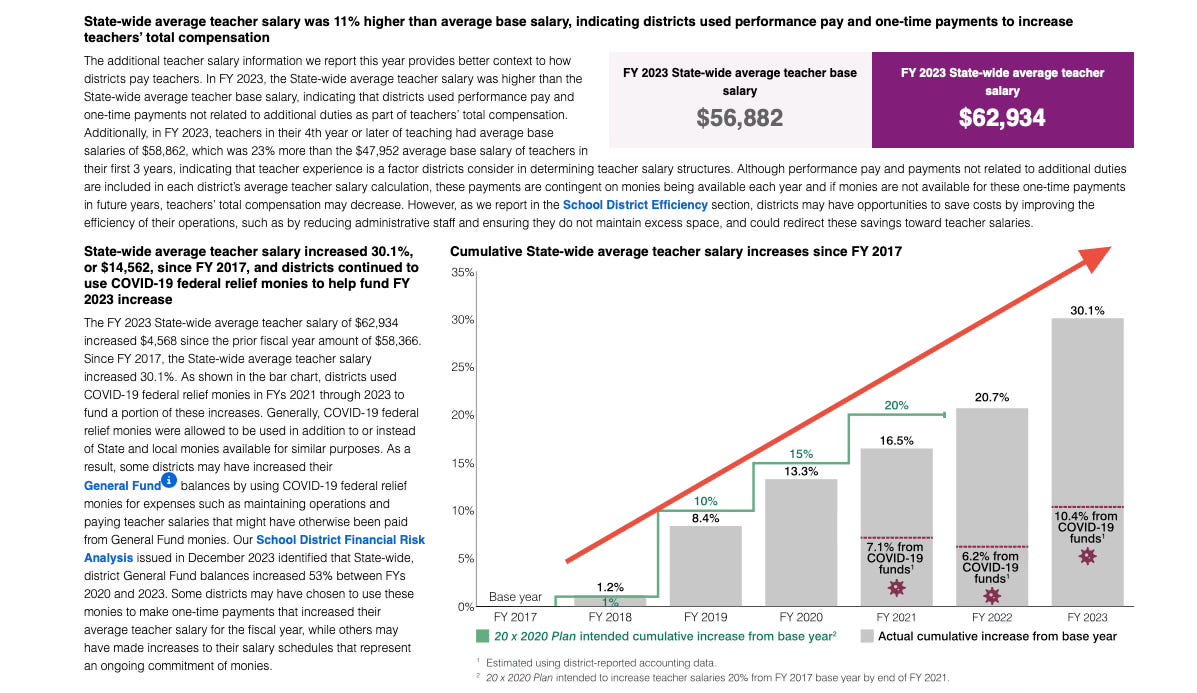
The Kicker? Teachers Got Raises Anyway
Thanks for reading this far. Last up - teacher pay is up over 30% since 2017. Now, go get angry and do something about it.
End.